26 Sep 2026
Executive Profiles and Patron Patterns Altering Casino Markets Across the Nation

Decision makers at major casino operators now come from varied professional backgrounds that include finance, technology, hospitality, and regulatory compliance, while attendance data reveals steady shifts in who visits casinos and when they arrive. These changes influence everything from property development to marketing strategies at venues nationwide, and researchers tracking the sector point to measurable differences in leadership composition and visitor demographics over the past decade.
Leadership Backgrounds Driving Operational Choices
Executives overseeing large casino groups often hold advanced degrees in business or law, and many previously worked at investment firms or technology companies before entering gaming, whereas others advanced through internal operations roles at regional properties. Data from industry reports shows that boards at publicly traded operators have increased representation from women and professionals with digital expertise since 2018, and this mix correlates with expanded investments in online platforms alongside traditional floor games. Those who studied casino management at universities in Nevada or New Jersey frequently emphasize regulatory navigation, while newcomers from Silicon Valley backgrounds focus on data analytics for player retention programs.
Regional operators in states such as Pennsylvania and Michigan tend to appoint leaders with deep ties to local government and labor unions, and these connections help secure expansion approvals more efficiently than in markets where outsiders dominate leadership teams. Attendance figures released in early 2025 indicate that properties led by executives with hospitality pedigrees maintain higher hotel occupancy rates during shoulder seasons compared with those guided primarily by gaming specialists.
Attendance Shifts by Age Group and Visit Frequency
Younger adults between twenty-five and forty now represent a larger share of total visits at many destinations, yet their average spend per trip remains lower than that of older cohorts, and operators respond by adding entertainment options and non-gaming amenities to extend dwell time. Figures compiled by state gaming commissions reveal that repeat visitation rates among seniors have declined slightly since the pandemic, while first-time visitors from nearby urban centers have increased in markets with new or expanded facilities. Mobile app usage for reservations and rewards tracking has risen sharply among all age brackets, and properties that integrated these tools earlier report steadier year-over-year attendance numbers.
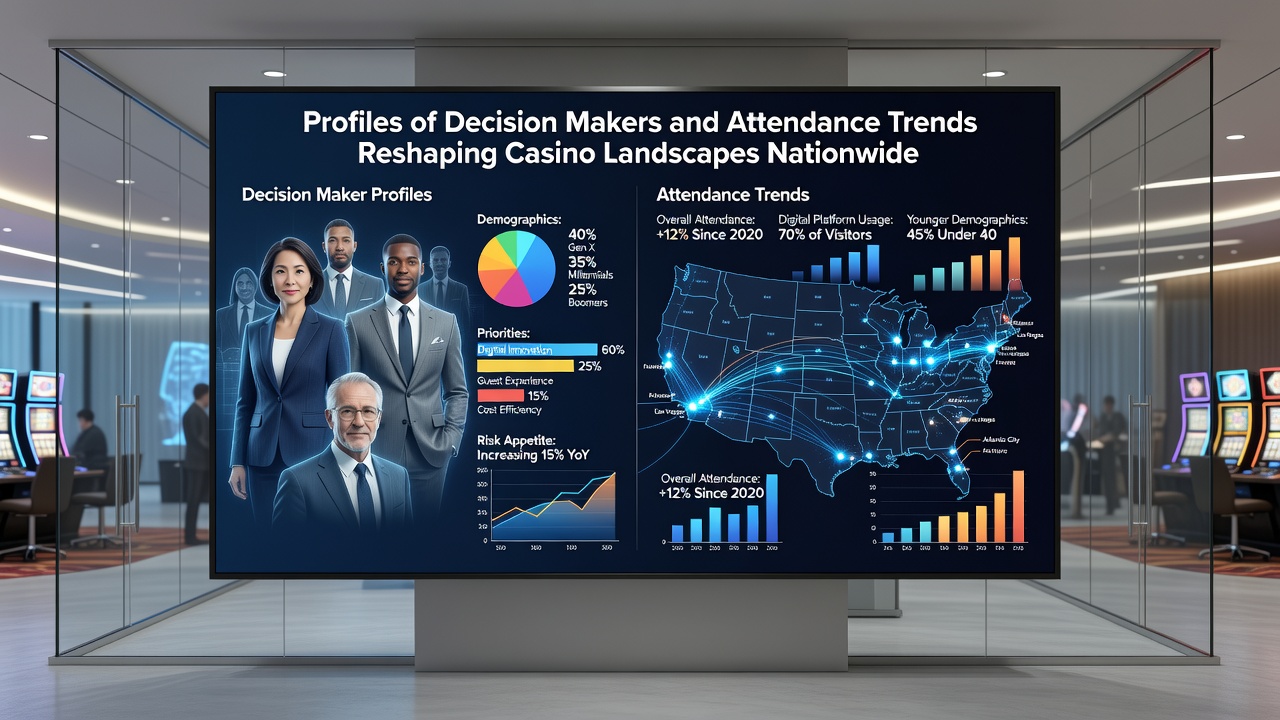
Seasonal patterns also show modification, with midweek visits climbing in several states after operators introduced targeted promotions tied to local events and sports seasons. Data indicates that attendance during September 2026 is projected to follow this trend, particularly at properties near professional sports venues that opened in recent years. Observers note that these patterns emerge most clearly when analysts compare monthly reports across multiple jurisdictions rather than relying on single-state snapshots.
Regional Variations in Decision Making and Visitor Behavior
Markets in the Northeast continue to attract a higher proportion of day-trip visitors who arrive by car or bus, whereas Southwestern and Midwestern properties draw more overnight guests who combine casino visits with regional tourism. Leaders at companies operating in both types of markets adjust staffing models and promotional calendars accordingly, and attendance reports confirm that properties offering integrated resort features sustain steadier revenue during slower periods. Canadian operators, tracked through sources such as the Canadian Gaming Association, demonstrate similar splits between urban and destination properties, providing comparative benchmarks that U.S. executives review when planning cross-border partnerships.
Regulatory environments further shape who reaches decision-making roles, since states with stricter licensing requirements often favor candidates with prior compliance experience. This emphasis appears in hiring announcements from operators in Illinois and New York, where new market entries have drawn leaders previously employed at established East Coast venues. Attendance data released quarterly by these commissions helps illustrate how quickly new properties stabilize visitor numbers after opening.
Integration of Technology and Data in Strategic Planning
Many leadership teams now rely on real-time dashboards that aggregate attendance, spend, and demographic information from multiple properties, and this practice allows quicker adjustments to marketing and floor layouts. Research from academic centers focused on hospitality management shows that operators adopting predictive modeling achieve more consistent attendance during traditionally slow months. Those same studies highlight that decision makers with prior analytics experience implement these tools more rapidly than peers from traditional gaming backgrounds.
Partnerships with external research institutions provide additional context, and reports from organizations tracking national gaming trends supply benchmarks that individual companies compare against their internal figures. Such comparisons help identify whether attendance changes reflect broader industry movements or property-specific factors.
Conclusion
Profiles of those guiding casino companies and patterns in who attends continue to evolve in measurable ways that affect property design, staffing, and long-term planning at venues across the country. Attendance metrics released through state agencies and industry associations offer ongoing evidence of these shifts, while leadership transitions documented in corporate filings reveal the backgrounds shaping responses. September 2026 data releases will likely extend these observations, allowing further comparison across regions and operator types.